SeisTrain utilizes Seismatters leading edge QC software to ensure the highest possible integrity of recorded seismic data with all of its mentors, and are covered extensively as modules with the SeisTrain training platform.
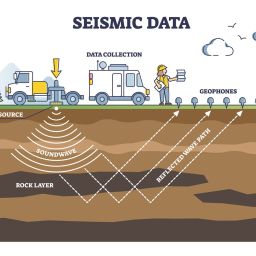
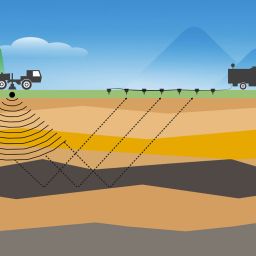
Land seismic acquisition is a complex and highly technical process using recording systems that can potentially utilize hundreds of thousands of recording channels simultaneously that could be spread out over vast areas of a prospect.
Ensuring the geophysical integrity of the data recorded is therefore paramount to the success or failure of a seismic acquisition program. Identifying problems quickly requires fit for purpose tools to resolve data quality issues and minimize the impact of potential technical downtime.
A number of factors can influence the quality of the acquired seismic data and analysis of these factors real time is needed to check that the data quality meets company and industry standards.
Factors that need to be analyzed include the performance of the recording system electronics to ensure it meets the manufacturer’s specification; the quality of the seismic signal recorded by the sensors coupled to the ground; and the quality of the signal from the seismic energy source dispatched into the ground.
Although recording systems do have built in diagnostic software to check system integrity, CSRs and Seismic Acquisition QCs require independent tools to be able to check and verify all aspects of the seismic data acquisition to be able to perform their job properly. SeisTrain has collaborated with Seismatters to provide such an array of software for this purpose.
Seismatters programs were written by an experienced electronics instrument technician with more than 30 years industry experience and extensive field experience both as a seismic technician and as a CSR. The analysis software was written using his technical knowledge combined with requirements for a hands-on approach in the field. Seismatters is at the forefront of QC analysis tools and competes with the best available in the industry.
All the programs are simple to use requiring input from data files output during the seismic acquisition process. User manuals are available for the more detailed programs to assist with parameter and test analysis set up. Written initially for conventional recording systems there is a strong focus on Sercel instrumentation. Sercel is by far the dominant recording system supplier at the moment and likely to remain so for quite some time. However, program development is ongoing and a number of programs now include options for new technology nodal recording systems.
The information below provides an overview of some of the Seimatters programs that are most applicable for daily and periodic use by an in-field CSR.
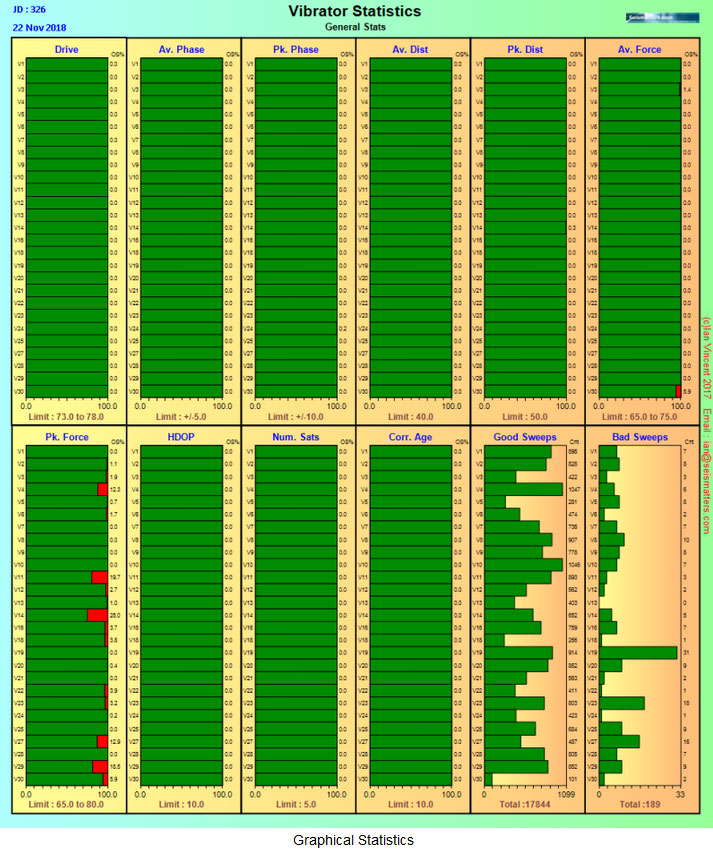
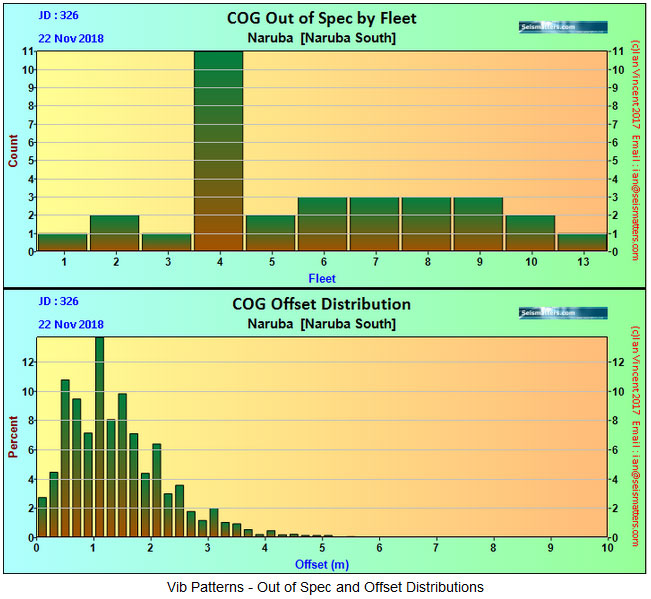
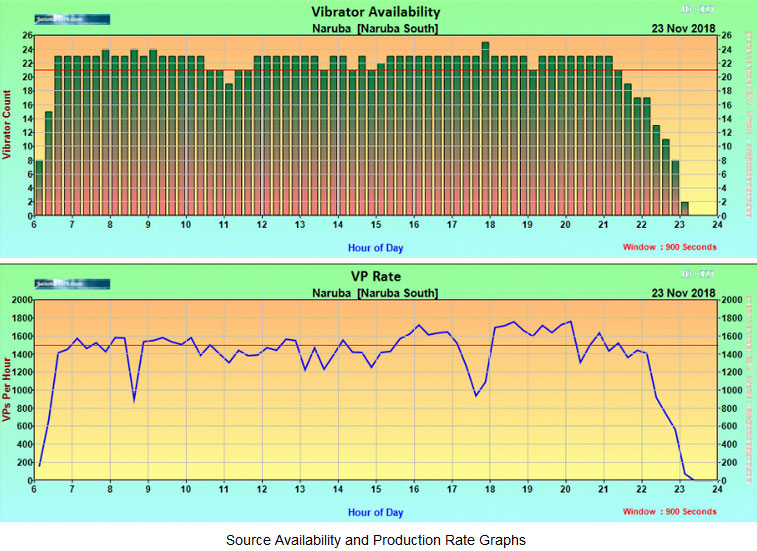
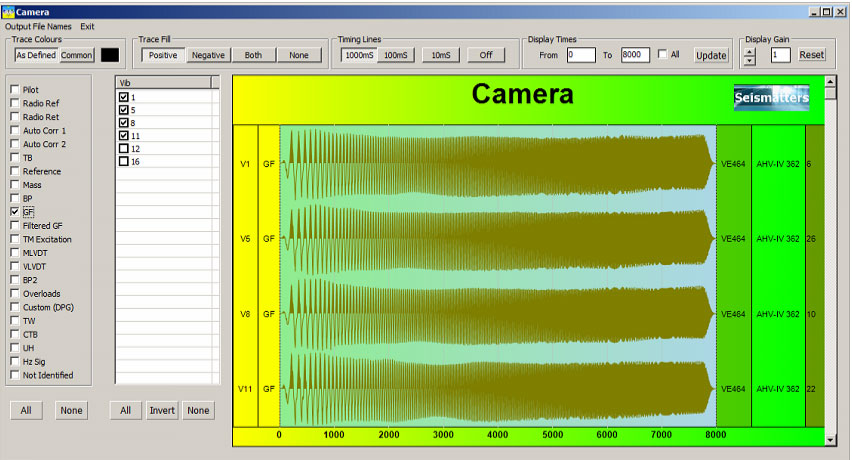
Monitoring the performance of the vibrators while sweeping is important to ensure attributes such as phase, distortion and force fall within acceptable levels. Vibrator control systems such as the Sercel VE464 report various sweep attributes and statuses for every vibrator and every sweep output to a file that allows for post-acquisition QC and statistical analysis of vibrator performance over time. An extensive set of graphical displays with data also available as jpeg and txt outputs is produced showing attribute statistics plus other useful information such as COG performance, vibrator availability, VP rates, etc. Data is stored in the database for historical review. An example of a graphical statistics display and other selective plots are shown below.
SLX2 is a program for displaying and analyzing the daily test results from the recorder (Sercel SN408 or SN428 only). It analyzes output files from instrument and sensor tests to allow QC of the recording spread with results displayed pictorially and as text. Example displays are shown below.


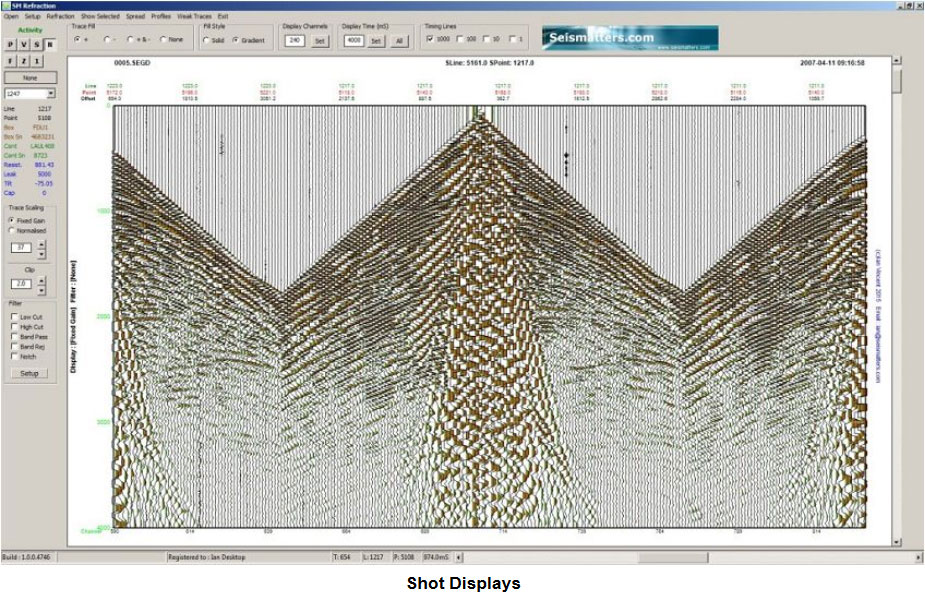
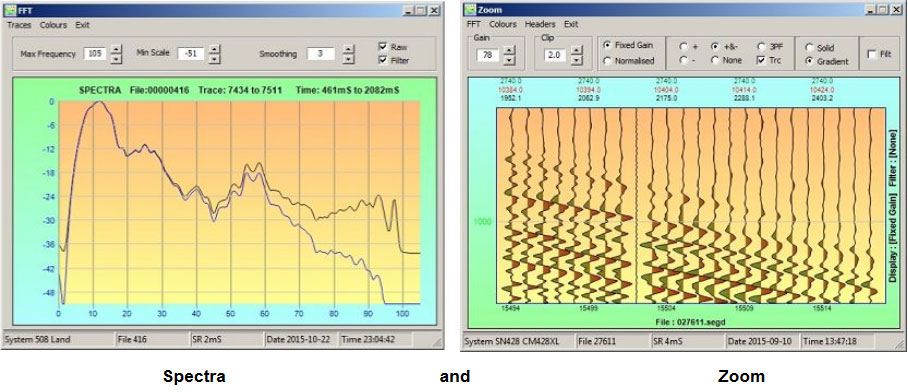
SMRefract is a multi-featured Seismic QC Tool and full featured viewer initially written to perform refraction statics. As well as a shot display and filter capability, it can show:
· FFT of a selected zone
· Zoom on a selected zone
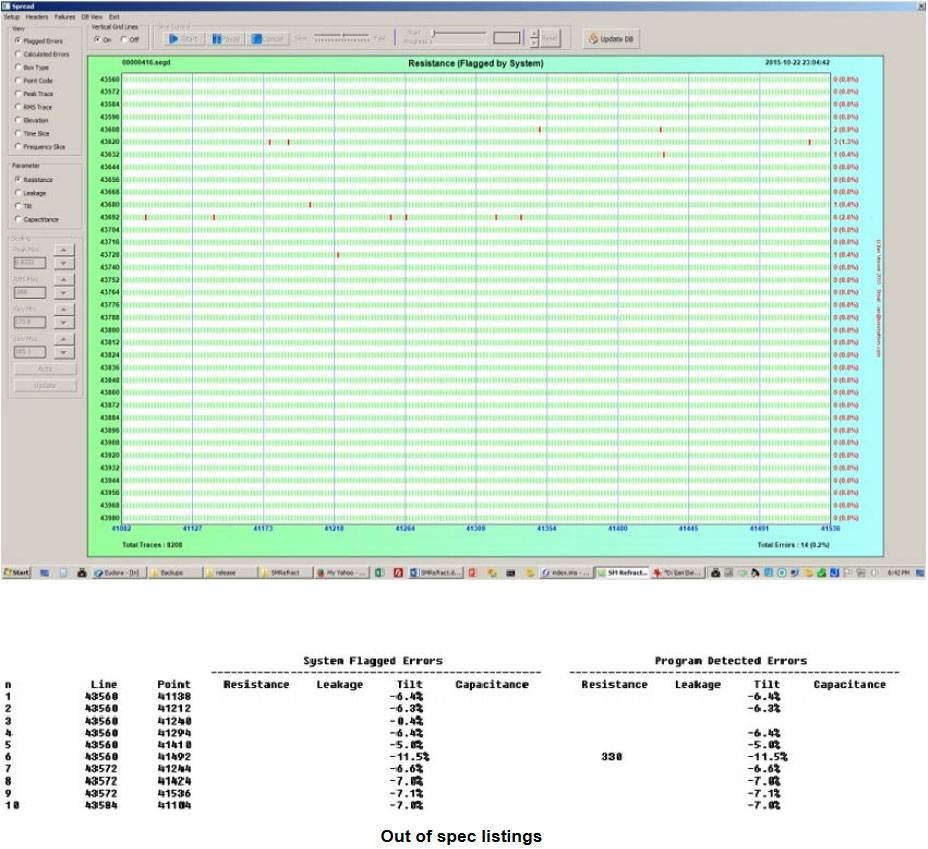
· Full spread status
· Single trace
· Selected traces (up to 12) from anywhere in the record
· Decoded Headers
· Line profiles of available statuses
· Weak and noisy traces
It also incorporates a database to keep track of failed stations. Example displays are shown below.
As can be seen in the third display below (Resistance – flagged by the system) the program can be utilized in a similar way as SLX2 for newer recording systems such as the Sercel 508.
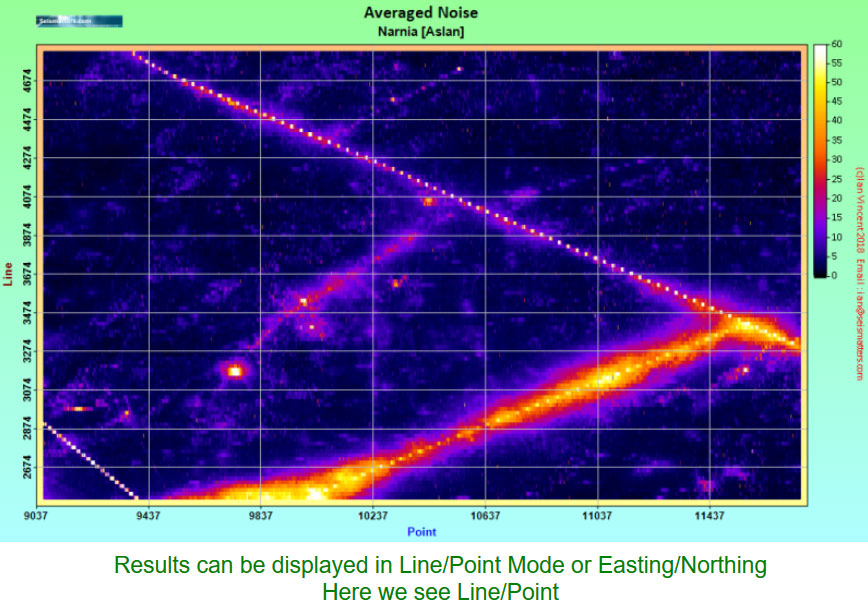
It is often useful to have a map of noise sources on a block, particularly on a 3D operation. PN2 uses the sensor test results that are normally acquired by a crew several times per day to generate an average of the noise level recorded at each receiver station over a period of days.
Noise sources can be either fixed, long term sources or transient ones that are localized and only present for a few shots e.g. a light vehicle crossing a line. By using the average noise level over time the transient noises fade and significant noises build up. Significant noises can then be evaluated and noted for processing and interpretation purposes. An example noise plot is shown below.
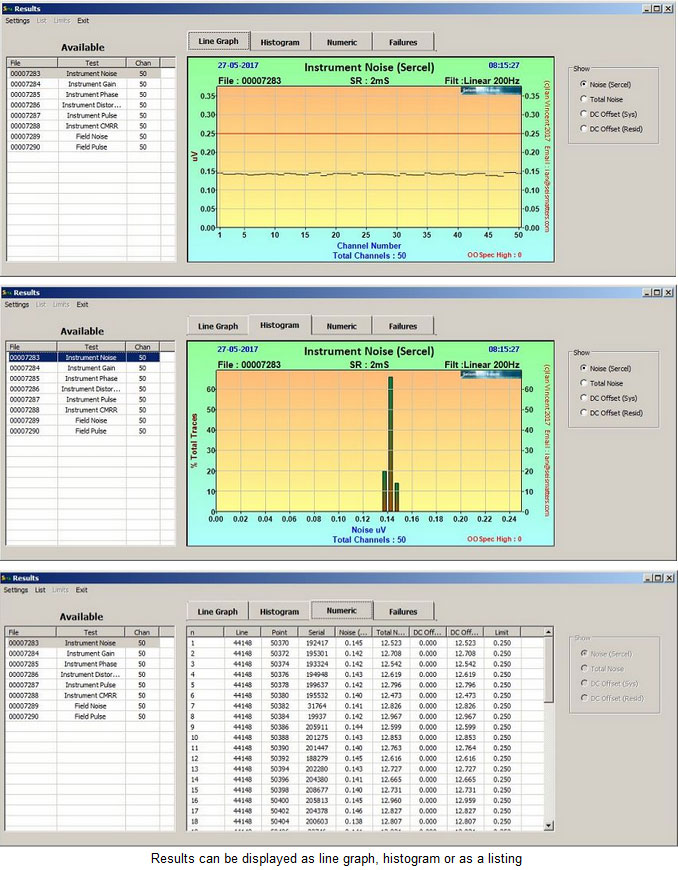
A common requirement these days is independent analysis of instrument tests. SITA is a program that processes Sercel Instrument test results from the recorded SEGD files for Sercel 408 and 428 systems. SITA508 is an updated version of the program for processing Sercel 508 instrument tests. The programs allow you to verify that the Sercel or other 3rd party test results are valid.
The programs provide good quality displays as well as test data listings. Currently the following tests can be processed by SITA508: FDU Noise, FDU Gain Error, FDU Phase Error, FDU CMRR, FDU Distortion, FDU Pulse, Sensor Noise, Sensor Resistance, Sensor Pulse and Sensor Tilt. Displays can be Copied to Clipboard or saved as PNG or PDF files. Example displays are shown below.
SMSim3 – Vibrator Similarities Analysis
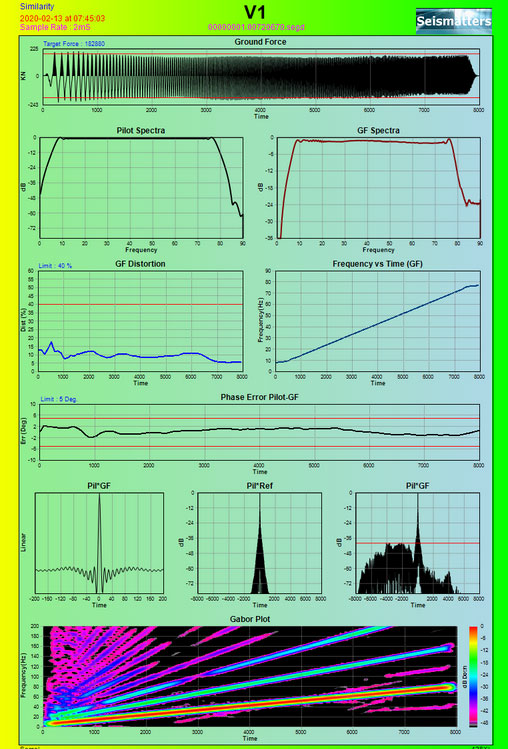
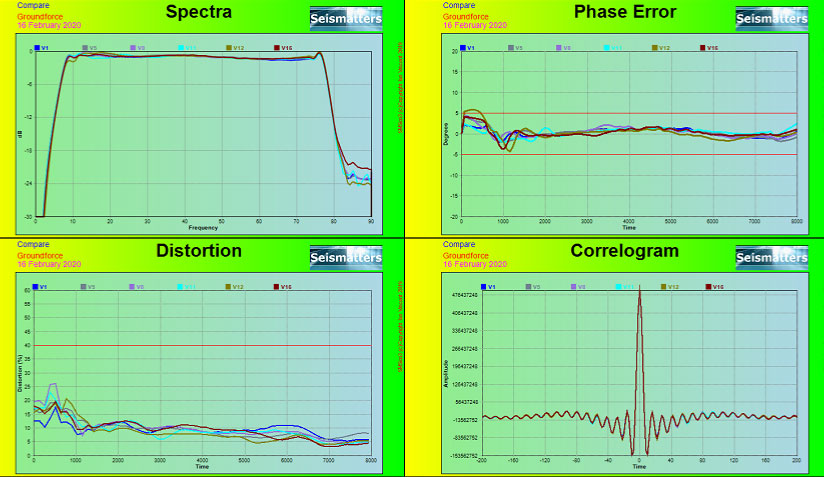
SMSim3 is a program that processes and analyzes vibrator similarities. Vibrator similarities compare the actual Vibroseis signal ground response with the Pilot or Reference sweep and are the definitive test of vibrator performance. SMSim3 can be used to process both Wireline Similarities and results from Independent Accelerometer test systems such as Testif-i. Plots produced are of report grade which is important for inclusion in technical and audit reports. Example plots are shown below.
In addition to the above most commonly used programs Seismatters also provides a) software for storage and display of SMT geophone test results; b) SEGD and SEGY header scanners and viewers; c) display panel software with filter and scaling parameters useful for parameter test analysis; and d) direct links to other useful technical software.
Seismatters is a one stop suite of software that provides the complete test analysis package for field based CSRs.